Research desk
Research Desk
Current findings with their denominators, the underlying data, and how to cite it. Built so that using our numbers correctly is easier than reproducing them badly.
Dataset updated 2026-08-22 · 43 products tracked · 8 with verified pricing
Current headline finding
As of 2026-08-29, 9 of the 32 active AI job-search tools tracked by Jobsearch.ing did not show a publicly readable price for an individual job seeker.
Publicly readable means a signed-out individual could see what the job-seeker product costs on the vendor's own public site. A region-dependent price and a product that is free both count as readable.
The products counted as not readable break down as 4 with no individual job-seeker price found on the public site, 3 with pricing behind a sign-in, 2 with only employer pricing published. Not all of these would be resolved by creating an account.
- Headline fact
- 9 of 32
- Population
- 32 active, in-scope AI job-search tools
- Coverage
- 32 / 32 pricing states resolved, 0 unknown
- Verified
- 2026-08-29
- Licence
- Published under CC BY 4.0. You may reuse and adapt this data, including commercially, provided you credit Jobsearch.ing, link to the licence, and indicate whether you changed anything. A link back to this page is welcome but is not a condition of the licence.
Cite it as
Jobsearch.ing, AI Job Search Tool Accountability Register, version 2026-08-29, accessed [date].
Think a figure is wrong
corrections@jobsearch.ing. Send the product, the field, what it should say and a public URL showing it.
43
products tracked
8
with pricing verified from the vendor
18.6% coverage
18
paid plans recorded with billing period
Current findings
What the data currently supports.
Each finding is stated with the population it describes. Please carry the denominator with the number — a market statistic without one is the problem this project exists to document.
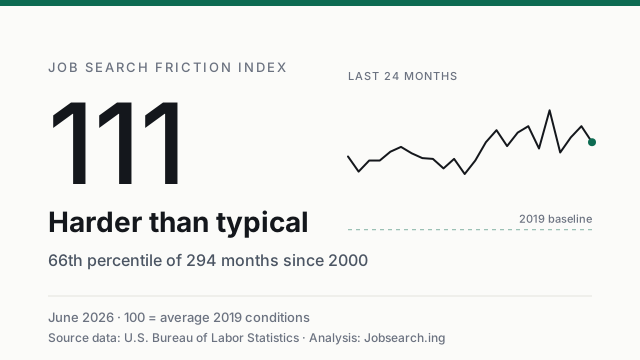
The Jobsearch.ing Job Search Friction Index reads 112.6 for 2026-07, where 100 is average 2019 conditions — the 69th percentile of 295 months since 2000, classified as harder than typical.
Basis: Composite of three BLS-derived dimensions; reference distribution of 295 months excluding March 2020 to February 2021
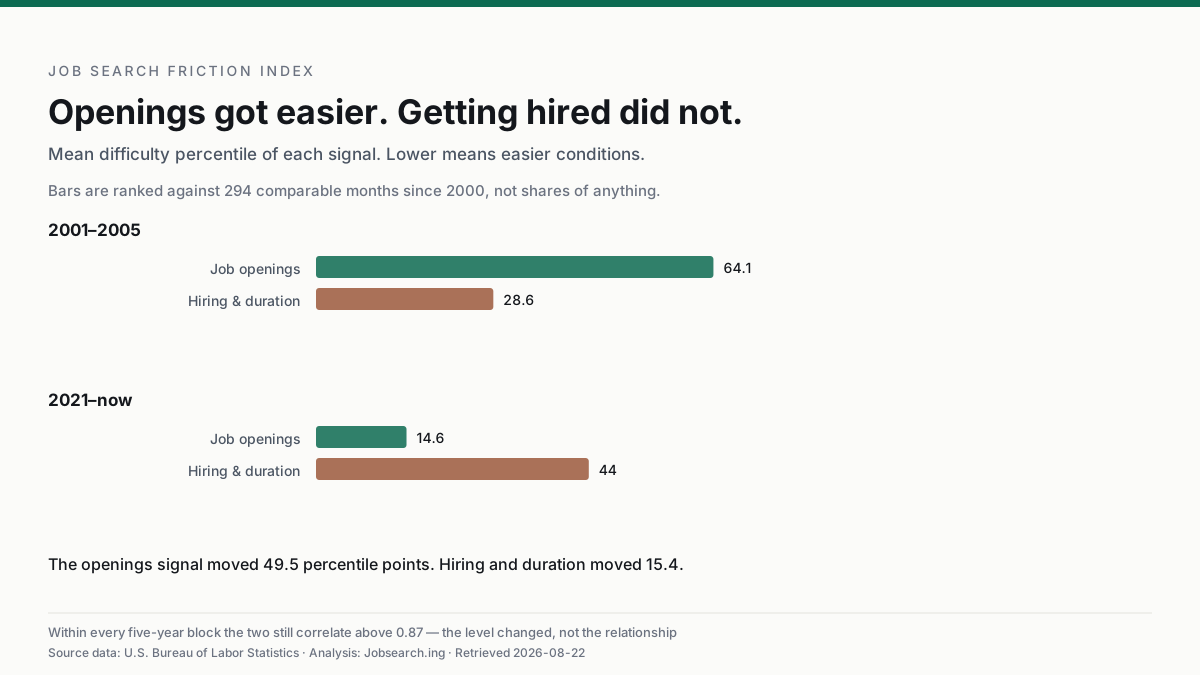
Job openings still track hiring as closely as they ever did — within every five-year block since 2001 the two signals correlate between 0.868 and 0.984. What changed is the level: the openings signal moved 49.6 percentile points toward "easier" between 2001–2005 and 2021–now while hiring and search duration moved 15.9.
Basis: Pearson correlation computed within five-year blocks so a level shift cannot present as a change in relationship; 294 comparable months
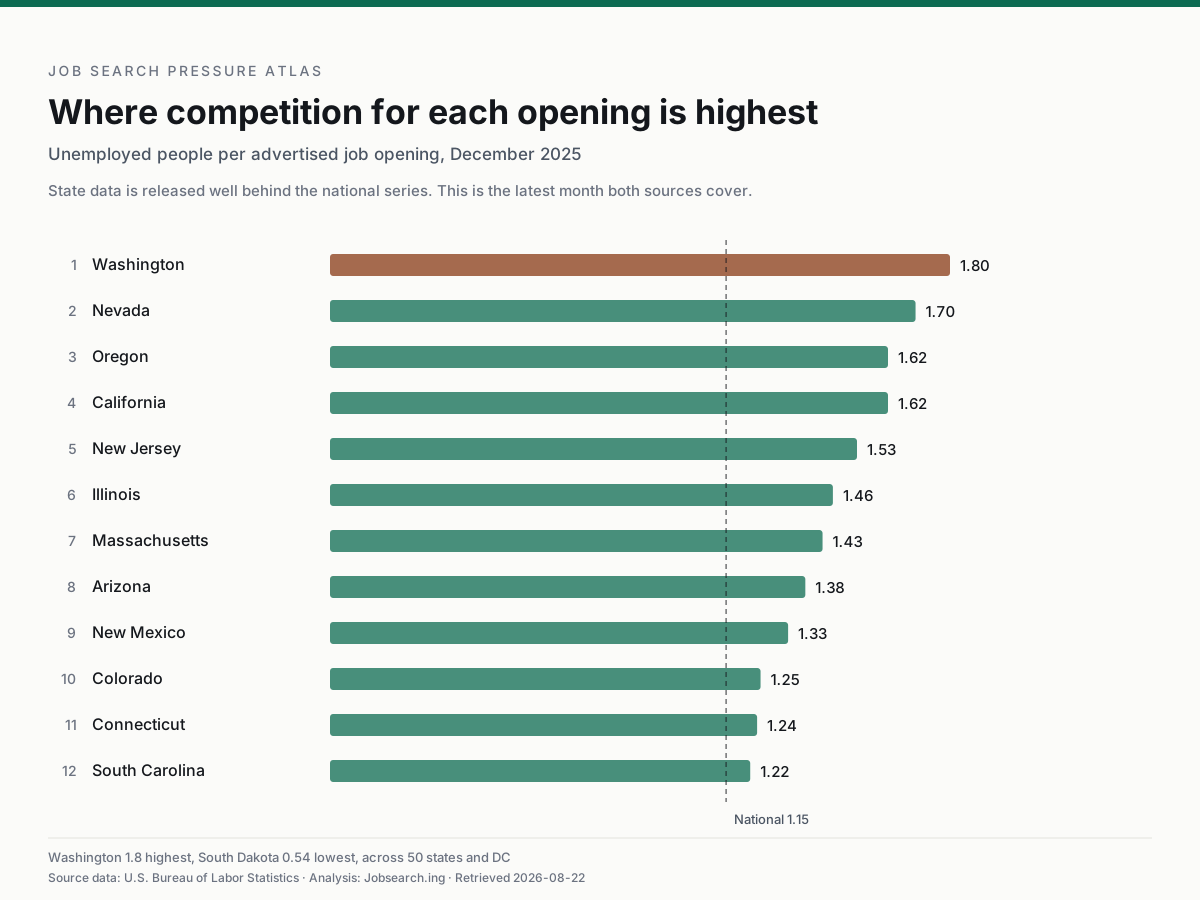
Washington has the most competition for each job opening of any state, at 1.8 unemployed people per opening. South Dakota has the least at 0.54 — a 3.33-fold spread across the country.
Basis: 51 states and DC, 2025-12, BLS state JOLTS and LAUS; state data is released well behind the national series
Ranking states by competition for openings is almost unrelated to ranking them by how fast employers hire (Spearman 0.006), and only partly related to ranking them by unemployment rate (0.679).
Basis: Rank correlation across 51 places, 2025-12
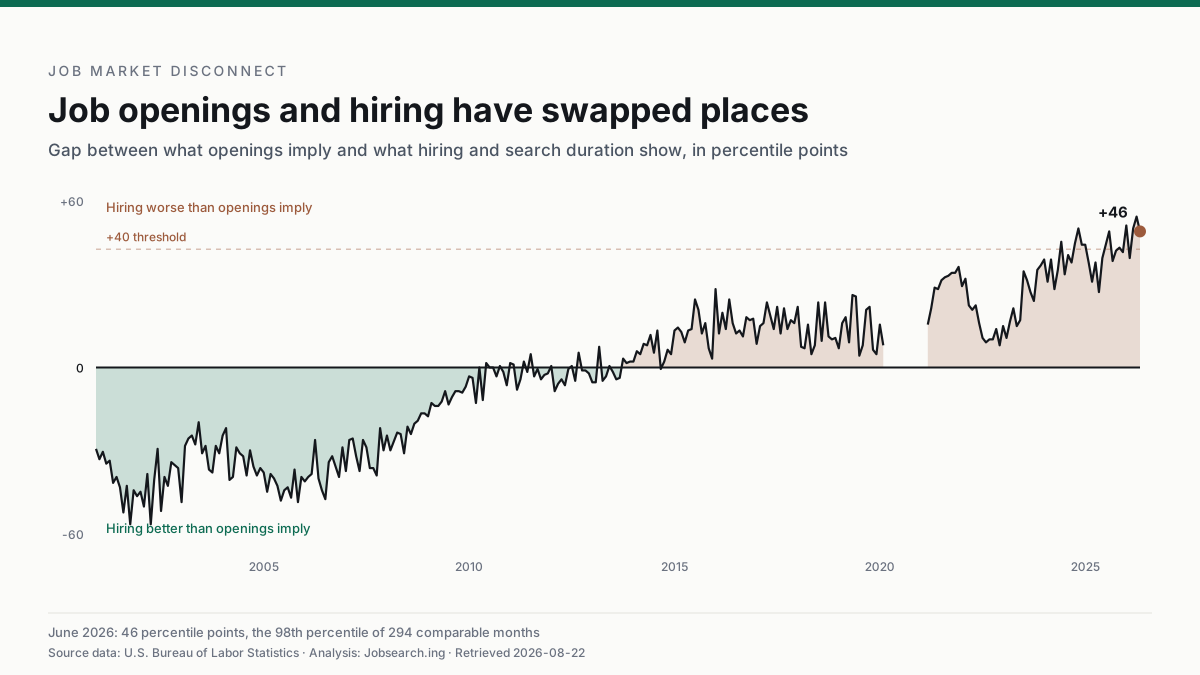
Openings and hiring have stopped agreeing. The gap between them — the average of the hiring and search-duration percentiles minus the opportunity percentile — is 52.5 points, the 100th percentile of 295 comparable months. No month before June 2024 exceeded 40 points in 23 years of data.
Basis: Derived from the same three dimensions as the index; correlates with the index itself at r = 0.04, so it measures something the headline number does not
Job-search difficulty has changed composition rather than level: opportunity pressure sits at the 23rd percentile of difficulty while hiring velocity sits at the 88th. There are openings; what has slowed is hiring and how long people stay unemployed.
Basis: 2026-07, components measured against 295 months of history
The index is up 3.9 points year on year and up 1.5 on the month.
Basis: Monthly series, data retrieved 2026-09-03
53% of paid plans that advertise a monthly rate do not charge that amount monthly — reaching the advertised price requires paying three, six or twelve months at once.
Basis: n = 15 paid plans across 8 products with verified pricing
The largest gap found: an advertised €8 a month that is charged as a single €96 payment for a year — twelve times the headline figure.
Basis: Kickresume Premium yearly plan, read from the vendor's pricing page
2 of 18 recorded paid plans are billed on a period that does not divide the year into twelve — one weekly, one every four weeks. A four-weekly plan charges thirteen times a year.
Basis: n = 18 paid plans
Median cheapest monthly-equivalent rate for USD-priced job-search tools: $null, ranging from $null to $null.
Basis: n = 6 products; euro-priced products reported separately and never converted
7 of 8 products with verified pricing offer an indefinitely usable free tier. A time-limited trial is not counted as a free plan.
Basis: n = 8 products with verified pricing
Automated applying — the most-discussed capability in this market — is verified in only 1 of 8 products with full records.
Basis: n = 8 products with verified feature records
The data
Download it and check us.
- Job Search Friction Index (CSV)
The full monthly series since 2000 with every component, so the index can be reproduced rather than taken on trust.
- Job Search Friction Index (JSON)
Current reading, classification, regime definitions, method, and the documented failure window.
- Job Market Disconnect (CSV)
The full monthly divergence series with the three component percentiles each row was built from.
- Job Market Disconnect (JSON)
Current reading, historical extremes, streaks, the era analysis, the co-movement test and four alternative definitions of the measure.
- Job Search Pressure by State (CSV)
All 50 states and DC: rank, unemployed per opening, openings rate, hires rate, unemployment rate and the year-on-year change.
- Job Search Pressure by State (JSON)
The same data with the period caveat, the independence checks and per-state canonical URLs.
- Current conditions (JSON)
A few hundred bytes: this month's index, classification, components, disconnect and triggers. For dashboards and scripts that do not need the history.
- Friction Meter (SVG)
The current reading as a vector card, with the baseline statement and attribution drawn inside the image.
- AI Job Search Tool Pricing Index (CSV)
Every verified plan: advertised rate, amount charged, billing period, annualised cost, verification date and source URL.
- Market census (CSV)
Every tracked product including those we have not priced, with category and coverage state.
- Market summary (JSON)
All headline figures with their denominators, plus the method statement and coverage caveat.
Friction Index pack
Everything needed to report the index correctly.
The current reading, what changed this month against a fixed threshold, the embed, and the one sentence that stops the number being misread.
Job Search Friction Index
112.6
Harder than typical
69th percentile of 295 months since 2000
July 2026 · Jobsearch.ing
Before you write the headline
112.6 is 12.6 index points above the 2019 baseline. It does not mean conditions are 13 per cent harder than 2019: the index is a standardised composite where 15 points is one standard deviation, so point gaps carry no percentage meaning. The safe short form is the percentile.
What crossed a threshold this month
- major52.5 vs 40
Openings and hiring are diverging by 52.5 percentile points, the 100th percentile of the series.
- major52.5 vs 51
The gap between openings and hiring is the widest in the series.
These are triggers, not conclusions. Each one names the value and the threshold it passed so the claim can be checked against the published series before anyone repeats it. Thresholds were fixed against 25 years of history, not chosen to make the current month sound dramatic.
Embed the meter
Static markup, inline styles, no script, nothing loaded from this site. It carries its month and its source inside it.
<div style="max-width:320px;border:1px solid #e4e3dd;border-radius:16px;padding:20px;font-family:system-ui,-apple-system,'Segoe UI',sans-serif;background:#fff;color:#14171c">
<div style="font-size:10px;letter-spacing:.14em;text-transform:uppercase;color:#6b7280">Job Search Friction Index</div>
<div style="font-size:56px;line-height:1;font-weight:500;margin-top:10px;font-variant-numeric:tabular-nums">112.6</div>
<div style="font-size:18px;font-weight:600;margin-top:10px">Harder than typical</div>
<div style="font-size:13px;color:#4b5563;margin-top:6px">69th percentile of 295 months since 2000</div>
<div style="border-top:1px solid #e4e3dd;margin-top:16px;padding-top:12px;font-size:11px;color:#6b7280">
July 2026 · Source data: U.S. Bureau of Labor Statistics ·
Analysis: <a href="https://jobsearch.ing/job-market/" style="color:#0d6b52">Jobsearch.ing</a>
</div>
</div>A vector version of the same card is at /data/friction-meter.svg, and the copy-ready findings and citation are on the index page itself.
Charts
Graphics built to be republished.
Each one is a vector that carries its own title, period, source and attribution inside the image, so it still says what it is after it has been screenshotted and separated from its caption.
- Job openings and hiring have swapped places
The full divergence series since 2000, with the inversion visible without reading anything.
- Openings got easier. Getting hired did not.
The level shift, as four bars. The finding the line chart cannot show at a glance.
- Where competition for each opening is highest
The twelve states with the most unemployed people per opening, against the national figure.
- The current Friction Index reading
A compact card with a 24-month trace, for a sidebar or a slide.
SVG rather than PNG throughout: it renders at any size, every tool that opens a PNG opens it too, and converting here would mean shipping an image encoder to save one step. Republication is free with attribution.
Local desks
46 state findings, for regional coverage.
Each names the value and what it beat, so it can be checked against the published table before it is repeated. 2025-12 data — state figures are released well behind the national series.
- majorWashington
Washington has the most competition for each job opening in the country: 1.8 unemployed people per opening.
- significantSouth Dakota
South Dakota has the least competition in the country: 0.54 unemployed people per opening, against a national figure of 1.15.
- significantWashington
Competition in Washington rose more than almost anywhere: 1.04 to 1.8 unemployed people per opening in a year.
- significantOregon
Competition in Oregon rose more than almost anywhere: 0.97 to 1.62 unemployed people per opening in a year.
- significantMassachusetts
Competition in Massachusetts rose more than almost anywhere: 0.86 to 1.43 unemployed people per opening in a year.
- significantNew Mexico
New Mexico moved 22 places up the national ranking in a year, from 31 to 9.
- significantSouth Carolina
South Carolina moved 16 places up the national ranking in a year, from 28 to 12.
- significantNew Hampshire
New Hampshire moved 19 places up the national ranking in a year, from 36 to 17.
- significantMichigan
Michigan moved 16 places down the national ranking in a year, from 2 to 18.
- significantMontana
Montana moved 15 places up the national ranking in a year, from 48 to 33.
- significantOhio
Ohio moved 25 places down the national ranking in a year, from 10 to 35.
- significantLouisiana
Louisiana moved 22 places down the national ranking in a year, from 14 to 36.
- significantMaine
Maine moved 22 places down the national ranking in a year, from 19 to 41.
- significantOregon
Oregon entered the ten states with the most competition for openings, from 12 to 3.
Showing 14 of 46. Every state has its own page with a ten-year history, a percentile against its own past and a comparison with the states it borders. The CSV carries all 51.
Citation
How to credit this work.
Plain text
Jobsearch.ing (2026). AI Job Search Market Observatory. Retrieved from https://jobsearch.ing/data/ai-job-search-tools/
Markdown
[AI Job Search Market Observatory](https://jobsearch.ing/data/ai-job-search-tools/), Jobsearch.ing, 2026-08-22
Where a figure originates with a vendor rather than with us — a price, a plan name — the vendor is the source and we are the analysis. Charts on our pages state both.
Corrections
Represent one of these companies?
If a fact about your product is wrong or out of date, tell us and we will re-verify it.
Send the product, the field that is wrong, what it should say, and a link to the page on your own site that shows it. We check the source, update the record and change the verification date.
Two things we will not do: change a fact without checking the source ourselves, and remove an accurate record because a vendor would prefer it were not published. A correction request enters verification; it does not overwrite anything.
Where to send it
corrections@jobsearch.ing, a monitored mailbox. We do not promise a response time, because we cannot guarantee one, and a missed commitment would be a second broken promise on top of the error being reported.
What a useful correction contains
- — Product name
- — The field that is wrong: price, plan, billing period, feature
- — What it should say
- — A URL on your own site that shows it
- — The date that page became accurate, if you know it
Method
How the data is produced.
Products are discovered through market research and recorded in a census. Pricing is read from each vendor’s own page in a browser, because most are client-rendered and a plain fetch returns nothing. Each figure is stored with its source URL and the date it was read.
We have not tested these products. Capabilities are recorded as verified yes, verified no, or not established — never guessed, and an unknown is never counted as a no.
Statistics are computed only over products with verified pricing, and every published figure carries its own denominator. Currencies are never converted or mixed.
There are no affiliate links, no sponsored placements and no paid inclusion anywhere on this site.