Job Search Friction Index
How Hard Is It to Find a Job Right Now?
A monthly measure of how hard it is to find work in the United States, built from public labour-market data. Updated for July 2026.
307 months since 2000-12 · Methodology v1.0.0 · Data retrieved 2026-09-03
July 2026
112.6
Harder than typical
- vs 2019 baseline
- Month on month
- Year on year
- Historical percentile
What this number is
An index, not a percentage. 112.6 means 12.6 index points above the 2019 baseline of 100, on a scale where 15 points is one standard deviation of the composite. It does not mean conditions are 13% harder than 2019 — the scale is a standardised composite and point differences carry no percentage meaning.
Last 24 months
Is it hard to find a job right now?
The Jobsearch.ing Job Search Friction Index reads 112.6 for July 2026, where 100 represents average 2019 conditions. That is the 69th percentile of 295 months since 2000, which the index classifies as harder than typical. Finding a job is harder than in 2019 and harder than a typical month of the past 25 years. The index combines three dimensions of public labour-market data: competition for openings, hiring speed, and how long people stay unemployed.
What the components say
Making search harder: hiring velocity (88th percentile), search duration (63rd percentile). Making it easier: opportunity pressure (23rd percentile).
History
Every month since 2000.
100 is average 2019 conditions. Higher means a harder search.
Source data: U.S. Bureau of Labor Statistics (JOLTS and Current Population Survey). Analysis: Jobsearch.ing.
91.6
Tightest market on record
March 2022 · 1st percentile
101.8
The 2019 baseline
June 2019 · 29th percentile
148.7
Great Recession worst
October 2009 · 99th percentile
112.6
Now
July 2026 · 69th percentile
Components
The three things being measured.
Each is standardised against its own history before being combined, so no single series can dominate the result.
Hiring velocity
3.2% hires rate
How quickly are employers actually hiring?
JOLTS hires rate, seasonally adjusted, as a percent of employment.
Search duration
10.5 weeks median · 25.5% long-term
How long are people spending unemployed, and how many get stuck?
CPS median duration of unemployment in weeks, blended evenly with the share of unemployed people out of work 27 weeks or longer. Both seasonally adjusted.
Opportunity pressure
0.95 unemployed per opening
How many people are competing for each opening?
CPS unemployment level divided by JOLTS job openings, both seasonally adjusted and both in thousands.
Job Market Disconnect
Why the job market feels worse than the openings data says.
Openings and hiring are telling different stories, and the gap between them is currently wider than in almost any month on record.
In July 2026 there were 0.95 unemployed workers for every job opening, which ranks in the easier 23rd percentile of the past 25 years. Over the same month, hiring velocity ranked at the 88th percentile of difficulty and search duration at the 63rd. Vacancies remain relatively plentiful, but employers are converting them into hires more slowly and unemployed workers are staying unemployed longer. The 52.5-point gap between those signals is the 100th percentile of 295 comparable months.
The measure is one subtraction between two numbers already on this page: the average of the hiring and search-duration percentiles, minus the opportunity percentile. Positive means hiring and search are worse than the supply of openings implies. Across 295 comparable months the median gap is 0.5 points — normally the two signals agree.
It is not a second index and not a restatement of the first: it correlates with the Friction Index at r = 0.04, which is close enough to zero that it is measuring something the index cannot see.
Current disconnect
+52.5
percentile points, 100th of 295 months
- Openings
- 23rd percentile of difficulty
- Hiring
- 88th percentile
- Search duration
- 63rd percentile
The relationship between openings and hiring has inverted
Average gap in percentile points, by period · n = 295
no months above +40
no months above +40
no months above +40
no months above +40
no months above +40
12 months above +40
Source data: BLS JOLTS and Current Population Survey
Analysis: Jobsearch.ing
Last updated: 2026-09-03
Bars are drawn from a shifted baseline because the earlier periods are negative; the figure shown on each bar is the true signed gap. Through the 2000s the gap ran around -34.7 points — hiring was consistently better than the supply of openings implied. It has moved steadily the other way since.
What we are not saying
This measures a divergence; it does not explain it. Job postings that stay open without being filled, slower interview processes, a mismatch between what is advertised and who is looking, and changes in how vacancies are posted would all produce this pattern, and these data cannot separate them. We can say the two signals have stopped agreeing, and how unusual that is.
Where this index fails
It reads May 2020 as one of the easiest months on record.
That is wrong, and it is worth knowing about before you rely on anything else here. During a mass layoff followed by mass rehiring, two of the three dimensions invert. Median duration collapses because the unemployment pool has just turned over and nobody has been searching long. The hires rate spikes to a record because furloughed workers are being recalled.
In May 2020 the index reads 72.8 — lower, meaning easier, than the tightest labour market on record in March 2022. Only the opportunity dimension registered the shock, and it was outvoted.
So March 2020 to February 2021 is marked on the chart and excluded from the reference distribution used for every percentile on this page. Those months still get an index value and still appear in the data; they are simply not treated as comparable.
The wider lesson holds outside that window: duration measures describe the stock of unemployed people, so they lag sharp changes by months. The index is a description of current conditions, not a leading indicator.
The data
Every month, every component.
The same numbers the index is computed from, and the same ones in the downloads.
- Month
- 2026-07
- Index
- 112.6
- Percentile
- 69th
- Unemployed per opening
- 0.95
- Hires rate
- 3.2%
- Median weeks
- 10.5
- Long-term share
- 25.5%
- Month
- 2026-06
- Index
- 111.1
- Percentile
- 66th
- Unemployed per opening
- 0.99
- Hires rate
- 3.4%
- Median weeks
- 11
- Long-term share
- 27.3%
- Month
- 2026-05
- Index
- 113.1
- Percentile
- 70th
- Unemployed per opening
- 0.97
- Hires rate
- 3.3%
- Median weeks
- 11.6
- Long-term share
- 27.5%
- Month
- 2026-04
- Index
- 111.7
- Percentile
- 66th
- Unemployed per opening
- 0.97
- Hires rate
- 3.3%
- Median weeks
- 11
- Long-term share
- 25.3%
- Month
- 2026-03
- Index
- 109.7
- Percentile
- 62nd
- Unemployed per opening
- 1.05
- Hires rate
- 3.5%
- Median weeks
- 11.5
- Long-term share
- 25.4%
- Month
- 2026-02
- Index
- 115
- Percentile
- 75th
- Unemployed per opening
- 1.09
- Hires rate
- 3.1%
- Median weeks
- 11.1
- Long-term share
- 25.3%
- Month
- 2026-01
- Index
- 110.2
- Percentile
- 62nd
- Unemployed per opening
- 1.02
- Hires rate
- 3.4%
- Median weeks
- 11
- Long-term share
- 24.7%
- Month
- 2025-12
- Index
- 113
- Percentile
- 70th
- Unemployed per opening
- 1.15
- Hires rate
- 3.3%
- Median weeks
- 11.4
- Long-term share
- 26%
- Month
- 2025-11
- Index
- 112.3
- Percentile
- 68th
- Unemployed per opening
- 1.14
- Hires rate
- 3.2%
- Median weeks
- 9.8
- Long-term share
- 24.4%
- Month
- 2025-09
- Index
- 110.5
- Percentile
- 64th
- Unemployed per opening
- 1.06
- Hires rate
- 3.3%
- Median weeks
- 10.1
- Long-term share
- 23.6%
- Month
- 2025-08
- Index
- 112.5
- Percentile
- 68th
- Unemployed per opening
- 1.07
- Hires rate
- 3.2%
- Median weeks
- 9.9
- Long-term share
- 25.6%
- Month
- 2025-07
- Index
- 111
- Percentile
- 65th
- Unemployed per opening
- 1.03
- Hires rate
- 3.3%
- Median weeks
- 10.2
- Long-term share
- 24.9%
- Month
- 2025-06
- Index
- 108.7
- Percentile
- 56th
- Unemployed per opening
- 0.98
- Hires rate
- 3.4%
- Median weeks
- 10.1
- Long-term share
- 23.3%
- Month
- 2025-05
- Index
- 107.1
- Percentile
- 49th
- Unemployed per opening
- 0.99
- Hires rate
- 3.4%
- Median weeks
- 9.5
- Long-term share
- 20.4%
- Month
- 2025-04
- Index
- 109
- Percentile
- 58th
- Unemployed per opening
- 1.01
- Hires rate
- 3.4%
- Median weeks
- 10.2
- Long-term share
- 23.5%
- Month
- 2025-03
- Index
- 107.7
- Percentile
- 52nd
- Unemployed per opening
- 1.03
- Hires rate
- 3.4%
- Median weeks
- 9.7
- Long-term share
- 21.3%
- Month
- 2025-02
- Index
- 109
- Percentile
- 57th
- Unemployed per opening
- 0.98
- Hires rate
- 3.3%
- Median weeks
- 9.9
- Long-term share
- 20.9%
- Month
- 2025-01
- Index
- 109
- Percentile
- 58th
- Unemployed per opening
- 0.92
- Hires rate
- 3.3%
- Median weeks
- 10.1
- Long-term share
- 21.1%
- Month
- 2024-12
- Index
- 109.7
- Percentile
- 61st
- Unemployed per opening
- 0.95
- Hires rate
- 3.3%
- Median weeks
- 10.2
- Long-term share
- 22.3%
- Month
- 2024-11
- Index
- 110.4
- Percentile
- 63rd
- Unemployed per opening
- 0.94
- Hires rate
- 3.3%
- Median weeks
- 10.7
- Long-term share
- 23.1%
- Month
- 2024-10
- Index
- 109.8
- Percentile
- 62nd
- Unemployed per opening
- 0.94
- Hires rate
- 3.3%
- Median weeks
- 10.2
- Long-term share
- 22.8%
- Month
- 2024-09
- Index
- 108.7
- Percentile
- 56th
- Unemployed per opening
- 0.99
- Hires rate
- 3.4%
- Median weeks
- 10
- Long-term share
- 23.5%
- Month
- 2024-08
- Index
- 108.7
- Percentile
- 57th
- Unemployed per opening
- 0.94
- Hires rate
- 3.3%
- Median weeks
- 9.6
- Long-term share
- 21.4%
- Month
- 2024-07
- Index
- 107.4
- Percentile
- 51st
- Unemployed per opening
- 0.96
- Hires rate
- 3.4%
- Median weeks
- 9.5
- Long-term share
- 21.5%
| Month | Index | Percentile | Unemployed per opening | Hires rate | Median weeks | Long-term share |
|---|---|---|---|---|---|---|
| 2026-07 | 112.6 | 69th | 0.95 | 3.2% | 10.5 | 25.5% |
| 2026-06 | 111.1 | 66th | 0.99 | 3.4% | 11 | 27.3% |
| 2026-05 | 113.1 | 70th | 0.97 | 3.3% | 11.6 | 27.5% |
| 2026-04 | 111.7 | 66th | 0.97 | 3.3% | 11 | 25.3% |
| 2026-03 | 109.7 | 62nd | 1.05 | 3.5% | 11.5 | 25.4% |
| 2026-02 | 115 | 75th | 1.09 | 3.1% | 11.1 | 25.3% |
| 2026-01 | 110.2 | 62nd | 1.02 | 3.4% | 11 | 24.7% |
| 2025-12 | 113 | 70th | 1.15 | 3.3% | 11.4 | 26% |
| 2025-11 | 112.3 | 68th | 1.14 | 3.2% | 9.8 | 24.4% |
| 2025-09 | 110.5 | 64th | 1.06 | 3.3% | 10.1 | 23.6% |
| 2025-08 | 112.5 | 68th | 1.07 | 3.2% | 9.9 | 25.6% |
| 2025-07 | 111 | 65th | 1.03 | 3.3% | 10.2 | 24.9% |
| 2025-06 | 108.7 | 56th | 0.98 | 3.4% | 10.1 | 23.3% |
| 2025-05 | 107.1 | 49th | 0.99 | 3.4% | 9.5 | 20.4% |
| 2025-04 | 109 | 58th | 1.01 | 3.4% | 10.2 | 23.5% |
| 2025-03 | 107.7 | 52nd | 1.03 | 3.4% | 9.7 | 21.3% |
| 2025-02 | 109 | 57th | 0.98 | 3.3% | 9.9 | 20.9% |
| 2025-01 | 109 | 58th | 0.92 | 3.3% | 10.1 | 21.1% |
| 2024-12 | 109.7 | 61st | 0.95 | 3.3% | 10.2 | 22.3% |
| 2024-11 | 110.4 | 63rd | 0.94 | 3.3% | 10.7 | 23.1% |
| 2024-10 | 109.8 | 62nd | 0.94 | 3.3% | 10.2 | 22.8% |
| 2024-09 | 108.7 | 56th | 0.99 | 3.4% | 10 | 23.5% |
| 2024-08 | 108.7 | 57th | 0.94 | 3.3% | 9.6 | 21.4% |
| 2024-07 | 107.4 | 51st | 0.96 | 3.4% | 9.5 | 21.5% |
The most recent 24 months. The full series from 2000-12 is in the downloads below.
Use this data
Free to cite and reuse with attribution. The underlying figures come from each vendor’s own pricing page; the analysis is ours.
Suggested citation
Jobsearch.ing (2026). Job Search Friction Index, July 2026: 112.6. Retrieved from https://jobsearch.ing/job-market/
Dataset updated 2026-09-03
Use this
Take the number, with the caveats attached.
The reading, the embed, and the underlying data are free to republish with attribution. Everything here carries the baseline statement inside it, so a figure that travels without its caption still says what it measures.
Job Search Friction Index
112.6
Harder than typical
69th percentile of 295 months since 2000
July 2026 · Jobsearch.ing
Not a dial or a gauge: those imply a bounded scale, and this index has no ceiling.
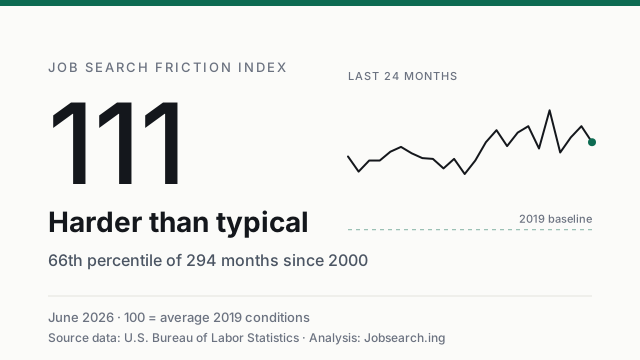
No PNG: the SVG renders at any size and every tool that would open a PNG opens this too. Converting it here would mean shipping an image encoder to save a publisher one step.
The embed
Static markup with inline styles and no script. It loads nothing from this site, which means it renders identically everywhere and cannot quietly become a tracking pixel. It shows the reading at the moment you copy it, so the month is printed on the card.
<div style="max-width:320px;border:1px solid #e4e3dd;border-radius:16px;padding:20px;font-family:system-ui,-apple-system,'Segoe UI',sans-serif;background:#fff;color:#14171c">
<div style="font-size:10px;letter-spacing:.14em;text-transform:uppercase;color:#6b7280">Job Search Friction Index</div>
<div style="font-size:56px;line-height:1;font-weight:500;margin-top:10px;font-variant-numeric:tabular-nums">112.6</div>
<div style="font-size:18px;font-weight:600;margin-top:10px">Harder than typical</div>
<div style="font-size:13px;color:#4b5563;margin-top:6px">69th percentile of 295 months since 2000</div>
<div style="border-top:1px solid #e4e3dd;margin-top:16px;padding-top:12px;font-size:11px;color:#6b7280">
July 2026 · Source data: U.S. Bureau of Labor Statistics ·
Analysis: <a href="https://jobsearch.ing/job-market/" style="color:#0d6b52">Jobsearch.ing</a>
</div>
</div>If you quote the number
112.6 is 12.6 index points above the 2019 baseline, not a percentage and not a score out of a hundred. The honest short form is “the 69th percentile of 295 months since 2000”, which needs no scale to be understood. We would rather be quoted correctly than quoted often.
Method
How the index is built.
Three dimensions, each drawn from official monthly series and each oriented so a higher number means a harder search: competition for openings, how fast employers are hiring, and how long people stay unemployed.
Each dimension is standardised against its own history using a median and a median absolute deviation, then averaged with equal weight. Standardising first is what stops unemployed-per-opening dominating: it swings across a thirteen-fold range while the other measures move within about two, so averaging them raw produced a number that tracked it at r = 0.98 and added nothing.
The result is rescaled so that average 2019 conditions read 100 and one standard deviation of the composite is 15 points. It is not capped at 100 and does not pretend to be a score out of a hundred — the Great Recession peak is above 148.
Percentiles compare the current reading against 295 months of history excluding the COVID window described above.
Source series
- JTS000000000000000JOL — Job openings level, BLS JOLTS
- JTS000000000000000HIR — Hires rate, BLS JOLTS
- LNS13000000 — Unemployment level, BLS Current Population Survey
- LNS13008276 — Median duration of unemployment, BLS Current Population Survey
- LNS13025703 — Unemployed 27 weeks and over, share of unemployed, BLS Current Population Survey
All series seasonally adjusted. Retrieved from the BLS public API on 2026-09-03. Regime bands: 20th percentile = 99.9, 40th percentile = 104.8, 60th percentile = 109.6, 80th percentile = 126.1, 95th percentile = 145.1.